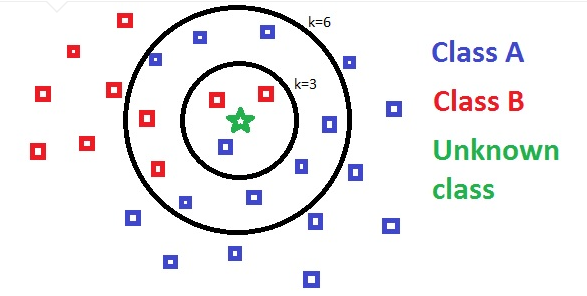
If we want to build recommender systems such as a movie recommender system then we need to understand the concept of finding the nearest neighbors. It is because the recommender system utilizes the concept of nearest neighbors.

The Python code given below helps in finding the K-nearest neighbors of a given data set:
Import the necessary packages as shown below. Here, we are using the NearestNeighbors module from the sklearn package:
import numpy as np
import matplotlib.pyplot as pltfrom sklearn.neighbors import NearestNeighbors
Let us now define the input data:
A = np.array([[3.1, 2.3], [2.3, 4.2], [3.9, 3.5], [3.7, 6.4], [4.8, 1.9],[8.3, 3.1], [5.2, 7.5], [4.8, 4.7], [3.5, 5.1], [4.4, 2.9],])
Now, we need to define the nearest neighbors:
k = 3
We also need to give the test data from which the nearest neighbors is to be found:
test_data = [3.3, 2.9]
The following code can visualize and plot the input data defined by us:
plt.figure()
plt.title('Input data')plt.scatter(A[:,0], A[:,1], marker='o', s=100, color='black')
Now, we need to build the K Nearest Neighbor. The object also needs to be trained:
knn_model = NearestNeighbors(n_neighbors=k, algorithm='auto').fit(X)
distances, indices = knn_model.kneighbors([test_data])
distances, indices = knn_model.kneighbors([test_data])
Now, we can print the K nearest neighbors as follows:
print("\nK Nearest Neighbors:")
for rank, index in enumerate(indices[0][:k], start=1):
print(str(rank) + " is", A[index])
for rank, index in enumerate(indices[0][:k], start=1):
print(str(rank) + " is", A[index])
We can visualize the nearest neighbors along with the test data point:
plt.figure()
plt.title('Nearest neighbors')
plt.scatter(A[:, 0], X[:, 1], marker='o', s=100, color='k')
plt.scatter(A[indices][0][:][:, 0], A[indices][0][:][:, 1],
marker='o', s=250, color='k', facecolors='none')
plt.scatter(test_data[0], test_data[1],
marker='x', s=100, color='k')
plt.show()
plt.title('Nearest neighbors')
plt.scatter(A[:, 0], X[:, 1], marker='o', s=100, color='k')
plt.scatter(A[indices][0][:][:, 0], A[indices][0][:][:, 1],
marker='o', s=250, color='k', facecolors='none')
plt.scatter(test_data[0], test_data[1],
marker='x', s=100, color='k')
plt.show()
Output
K Nearest Neighbors
1 is [ 3.1 2.3]
2 is [ 3.9 3.5]
3 is [ 4.4 2.9]
1 is [ 3.1 2.3]
2 is [ 3.9 3.5]
3 is [ 4.4 2.9]
We have implemented the KNN algorithm, in the next post we are going to build a KNN classifier using this algorithm.
0 comments:
Post a Comment