Which of the following do you think is an example of time series? Even if you don’t know, try making a guess.

Time Series is generally data that is collected over time and is dependent on it. Here we see that the count of cars is independent of time, hence it is not a time series. While the CO2 level increases with respect to time, hence it is a time series.
Let us now look at the formal definition of Time Series.
This article was published as a part of the Data Science Blogathon.
Introduction on Time Series Forecasting Python
Unicorn Investors wants to make an investment in a new form of transportation – JetRail. JetRail uses Jet propulsion technology to run rails and move people at a high speed! The investment would only make sense if they can get more than 1 Million monthly users within the next 18 months. In order to help Unicorn Ventures in their decision, you need to forecast the traffic on JetRail for the next 7 months. You are provided with traffic data of JetRail since inception in the test file.
You can get the dataset here
It is advised to look at the dataset after completing the hypothesis generation part.
Let’s Understand, What is Time Series Data?
Which of the following do you think is an example of time series? Even if you don’t know, try making a guess.
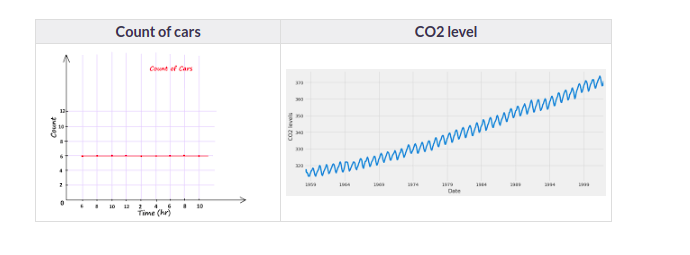
Time Series is generally data that is collected over time and is dependent on it. Here we see that the count of cars is independent of time, hence it is not a time series. While the CO2 level increases with respect to time, hence it is a time series.
Let us now look at the formal definition of Time Series.
A series of data points collected in time order is known as a time series. Most business houses work on time series data to analyze sales numbers for the next year, website traffic, count of traffic, the number of calls received, etc. Data of a time series can be used for forecasting.
Not every data collected with respect to time represents a time series. Some of the examples of time series prediction Python are:
Stock Price

Passenger Count of Airlines

Temperature Over Time

A Number of Visitors in a Hotel

Now that we can differentiate between a Time Series and a non-Time Series data. let us explore Time Series further.
Now as we have an understanding of what a time series is and the difference between a time series and a non-time series, let’s look at the components of a time series in the next post.