1. Trend: A trend is a general direction in which something is developing or changing. So we see an increasing trend in this time series. We can see that the passenger count is increasing with the number of years. Let’s visualize the trend of a time series:
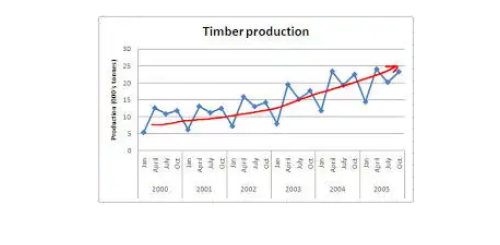
Example
Here the red line represents an increasing trend of the time series.
2. Seasonality:– Another clear pattern can also be seen in the above time series, i.e., the pattern is repeating at a regular time interval which is known as the seasonality. Any predictable change or pattern in a time series that recurs or repeats over a specific time period can be said to be seasonality. Let’s visualize the seasonality of the time series:
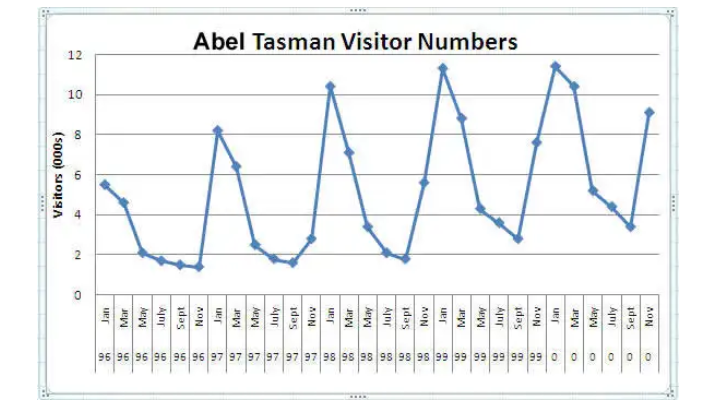
Example
We can see that the time series is repeating its pattern after every 12 months i.e there is a peak every year during the month of January and a trough every year in the month of September, hence this time series has a seasonality of 12 months.
Difference Between a Time Series and Regression Problem
Here you might think that as the target variable is numerical it can be predicted using regression techniques, but a time series problem is different from a regression problem in the following ways:
- The main difference is that a time series is time-dependent. So the basic assumption of a linear regression model that the observations are independent doesn’t hold in this case.
- Along with an increasing or decreasing trend, most Time Series have some form of seasonality trends,i.e. variations specific to a particular time frame.
So, predicting a time series using regression techniques is not a good approach.
Time series analysis comprises methods for analyzing time-series data in order to extract meaningful statistics and other characteristics of the data. Time series forecasting is the use of a model to predict future values based on previously observed values.
0 comments:
Post a Comment