If you’ve worked with other numeric libraries or languages, you know that many basic statistic calculations either come with the library or are built into the language. Let’s look at our Gapminder data again.
print(df.head(n=10))

There are several initial questions that we can ask ourselves:
- For each year in our data, what was the average life expectancy? What is the average life expectancy,
- population, and GDP?
- What if we stratify the data by continent and perform the same calculations?
- How many countries are listed in each continent?
To answer the questions just posed, we need to perform a grouped (i.e., aggregate) calculation. In other words, we need to perform a calculation, be it an average or a frequency count, but apply it to each subset of a variable.
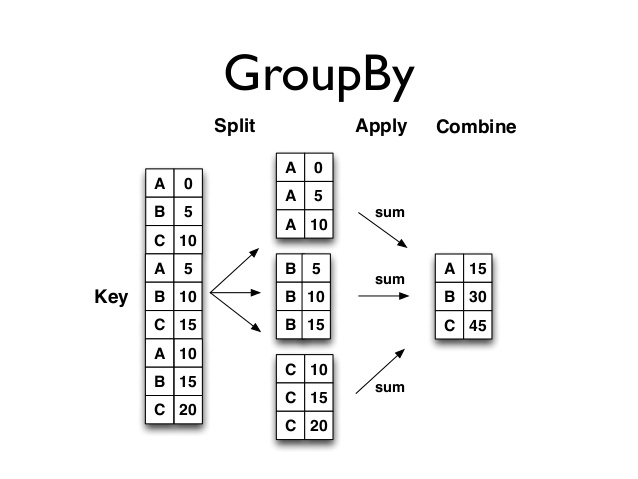
Another way to think about grouped calculations is as a split–apply–combine process. We first split our data into various parts, then apply a function (or calculation) of our choosing to each of the split parts, and finally combine all the individual split calculations into a single dataframe. We accomplish grouped/aggregate computations by using the groupby method on dataframes.
# For each year in our data, what was the average life expectancy?
# To answer this question,
# we need to split our data into parts by year;
# then we get the 'lifeExp' column and calculate the mean
print(df.groupby('year')['lifeExp'].mean())

Let’s unpack the statement we used in this example. We first create a grouped object. Notice that if we printed the grouped dataframe, Pandas would return only the memory location.
grouped_year_df = df.groupby('year')
print(type(grouped_year_df))
<class 'pandas.core.groupby.DataFrameGroupBy'>
print(grouped_year_df)
<pandas.core.groupby.DataFrameGroupBy object at 0x7fe424583438>
From the grouped data, we can subset the columns of interest on which we want to perform our calculations. To our question, we need the lifeExp column. We can use the subsetting methods discussed in previous posts.
print(type(grouped_year_df_lifeExp))
<class 'pandas.core.groupby.SeriesGroupBy'>
print(grouped_year_df_lifeExp)
<pandas.core.groupby.SeriesGroupBy object at 0x7fe423c9f208>
Notice that we now are given a series (because we asked for only one column) in which the contents of the series are grouped (in our example by year).
Finally, we know the lifeExp column is of type float64. An operation we can perform on a vector of
numbers is to calculate the mean to get our final desired result.
mean_lifeExp_by_year = grouped_year_df_lifeExp.mean()
print(mean_lifeExp_by_year)

We can perform a similar set of calculations for the population and GDP since they are of types int64 and float64, respectively. But what if we want to group and stratify the data by more than one variable? And what if we want to perform the same calculation on multiple columns?
# the backslash allows us to break up 1 long line of Python code
# into multiple lines
# df.groupby(['year', 'continent'])[['lifeExp', 'gdpPercap']].mean()
# is the same as the following code
multi_group_var = df.groupby(['year', 'continent'])[['lifeExp', 'gdpPercap']].mean()
print(multi_group_var)

The output data is grouped by year and continent. For each year–continent pair, we calculated the average life expectancy and average GDP. The data is also printed out a little differently. Notice the year and continent “column names” are not on the same line as the life expectancy and GPD “column names.”
If you need to “flatten” the dataframe, you can use the reset_index method.
flat = multi_group_var.reset_index()
print(flat.head(15))

Another common data-related task is to calculate frequencies which we'll discuss in the next post.
0 comments:
Post a Comment