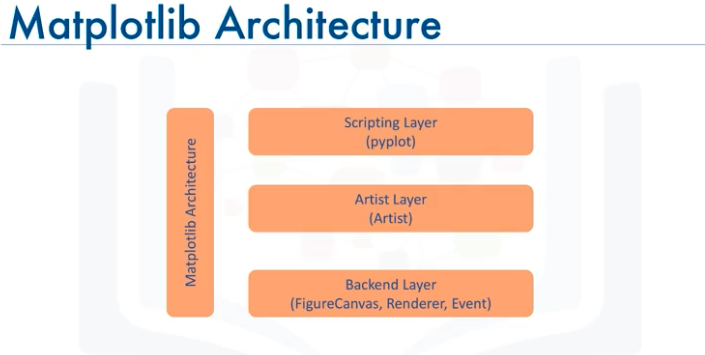
matplotlib is a Python module for generating graphical output to your computer screen or to a computer file. Fundamentally, its job is to translate Python scripts into graphical instructions that your computer can understand. It does this using two different layers of software, the backend layer and the artist layer. To these two layers it adds a scripting layer, PyPlot, which we have met already (import matplotlib.pyplot as plt). PyPlot is a convenience layer, and not really necessary, but it facilitates rapid scripting, and aids with portability.
As you shall see, for most programming we advocate using a hybrid of the scripting and artist layers. Figure shown below portrays the matplotlib software hierarchy.
The backend layer
We’ll start by considering the task of creating a figure on your computer screen. matplotlib must be able to generate graphics using different computer platforms: Linux, Microsoft Windows, and macOS. Of course, we want matplotlib to do this in a way that is transportable from one platform to another and transparent to you the user. Ideally, the Python matplotlib code you write on your PC should work without modification on your friend’s Mac or Linux computer.
To accomplish this, matplotlib uses open source cross-platform software toolkits written by third parties. There are a number of different toolkits available. Most of these toolkits can write graphics to
computer screens on different platforms, includingWindows, macOS, and Linux. They are written mostly in C++, and are very efficient and powerful. To harness their power and versatility, matplotlib provides a number of Python “wrappers”—Python functions—that call the C++ functions of these toolkits to send graphics instructions to your computer. matplotlib calls these wrappers backends.
Several backends have been written for matplotlib. They fall into two categories: those written for output to files—hardcopy backends—and those for output to a computer screen—user interface
backends, also known as interactive backends.
For output to a computer screen, the qt5Agg backend is among the most versatile and widely used, so we will use it as an example of what an interactive backend does. The qt5Agg backend is made from two C++ toolkits: Qt and Agg. Qt can define windows on your computer screen, create buttons, scrollbars, and other widgets, that is to say, elements of a GUI. It can also process events, actions like
clicking a mouse, pressing a keyboard key, moving a scroll bar, or pressing a button. This includes processing events generated by the computer, rather than the user, like an alarm clock going off or a process finishing. The Agg toolkit is a rendering program that produces pixel images in memory from vectorial data. For example, you provide Agg with the equation for a circle and it determines which pixels toactivate on the computer screen. It employs advanced rendering techniques like anti-aliasing to produce faithful high-resolution graphics.
The job of a matplotlib backend is to provide a Python interface to the functionality of the underlying C++ (or other language) toolkits, which for qt5Agg are qt5 and Agg. The Python-facing parts of all
matplotlib backends have three basic classes:
FigureCanvas defines the canvas—a figure window or a graphics file—and transfers the output from the Renderer onto this canvas. It also translates Qt events into the matplotlib Event framework.
Renderer does the drawing. Basically, it connects matplotlib to the Agg library described above.
Event handles user inputs such as keyboard and mouse events for matplotlib.
Besides the qt5Agg backend, there are several other commonly used interactive backends: TkAgg, GTK3Agg, GTK3Cairo, WXAgg, and macOSX to name a few. Why all the different backends? Part of the reason is historical. Early on in the development of matplotlib, many toolkits worked on only one platform, meaning that a separate backend had to be developed for each one. As time has passed,
most toolkits became cross-platform. As better cross-platform graphical tools, generally written in C++, were developed, programmers in the Python world wanted access to their functionality. Hence the different backends.
As mentioned earlier, there are also hardcopy backends that only produce graphical output to files. These include Agg (which we already met as part of qt5Agg), PDF (to produce the Adobe portable
document format), SVG (scalable vector graphics), and Cairo (png, ps, pdf, and svg). In the end, the idea of a matplotlib backend is to provide the software machinery for setting up a canvas to draw on and the low-level tools for creating graphical output: plots and images. The drawing tools of the backend layer, while sufficient for producing any output you might want, work at too low of a level to be useful for everyday programming. For this, matplotlib provides another layer, the artist layer, which provides the software tools you will use for creating and managing graphical output.
In the next post well discuss the artist layer.
0 comments:
Post a Comment